Back-of-envelope estimation
The 3-step estimation formula for system design interviews: practical reference values, decision-driving math, and shortcuts that save time.
TL;DR
- Estimation in interviews isn't about false precision. It's about arriving at a number that drives a design decision within a few minutes.
- Every estimation follows the same 3-step formula: Users → Actions → Resources. Start from DAU, convert to requests/second, then compute storage and bandwidth.
- Use illustrative infrastructure starting points: a single PostgreSQL instance around ~10K reads/sec, a single Redis instance around ~100K ops/sec, and a single app server around ~1K-10K req/sec depending on request profile. When measured traffic exceeds a measured capacity, evaluate the next scaling strategy.
- The read-to-write ratio is often a central number in an estimation. It helps determine whether a cache, read replicas, write distribution, or none of them is appropriate.
- Round aggressively. 86,400 seconds in a day? Use 100,000. It's close, and the mental math is instant. Your interviewer cares that you know which numbers matter, not that you can divide by 86,400.
Why this framework matters
You're designing a URL shortener. Your teammate says: "Let's shard the database." But the system only handles an illustrative 100 writes per second, while the working assumption for a single PostgreSQL instance is 10,000 writes per second. Under those assumptions, sharding adds complexity without addressing a measured bottleneck.
This is what happens without estimation. Engineers reach for sophisticated solutions because they sound impressive, not because the math demands them. Estimation is the filter that prevents your design from being either too simple (under-provisioned) or too complex (over-engineered).
For example, a system that processes an illustrative 500 requests per second may fit a small application deployment, depending on the request profile. Adding Kafka, Redis, Cassandra, and a CDN without a requirement for them creates complexity that the estimate does not justify.
In an interview, estimation makes design decisions defensible. When asked "Why did you add a cache?", connect the assumption to the measured or illustrative capacity: "Our read traffic is 500K/sec, while the working single-database assumption is 10K reads/sec. Even with five replicas, the cache or another read strategy would still need to absorb the remaining load." The exact choice depends on the query profile, latency target, and benchmark.
Estimation isn't math class
A common mistake in estimation is spending too long on arithmetic. The difference between 4.2 TB and 5.1 TB may not change the architecture. Identify storage as a concern, arrive at "roughly 5 TB over 5 years," and spend the remaining time on the design decisions the number enables.
When to use this framework
Use this method when a system-design prompt or design review needs an early order-of-magnitude answer for traffic, storage, bandwidth, or resource count. Pull it into the requirements, architecture, or deep-dive discussion whenever a number can change a component choice. Stop once the estimate is sufficient to choose the next design step; do not turn it into accounting.
The numbers in this article are illustrative planning assumptions. Hardware, workload, schema, configuration, network path, provider, cache behavior, and failure mode can change them substantially. Benchmark the critical path before treating a threshold as capacity.
Step-by-step method: estimate and decide
Start with the reference values as mental anchors, then run the three-step calculation below. The values are useful only when they lead to an explicit design decision and a measurement plan.
Reference values
Use the ratios and order of magnitude, then label the assumptions and validate the values that affect a real capacity or cost decision.
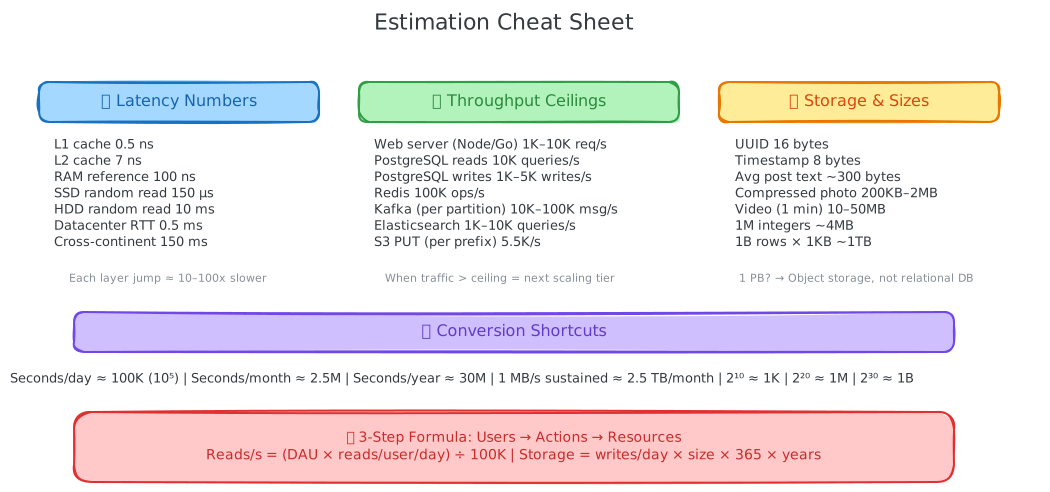
Latency numbers (approximations)
| Operation | Latency | Mental model |
|---|---|---|
| L1 cache reference | 0.5 ns | Instantaneous |
| L2 cache reference | 7 ns | Still CPU cache |
| RAM reference | 100 ns | Nanoseconds |
| SSD random read | 150 μs | Microseconds |
| HDD random read | 10 ms | Milliseconds (slow) |
| Same-datacenter round trip | 0.5 ms | Network hop |
| Cross-continent round trip | 150 ms | User-perceptible |
The key insight is the order-of-magnitude gap between layers. RAM, SSD, HDD, and cross-continent network paths can differ by tens to thousands of times depending on the operation. This is why caches and locality matter, but the exact ratio must be measured for the path being designed.
Illustrative throughput starting points (single instance)
| Component | Throughput | When you exceed this... |
|---|---|---|
| Web server (Node.js/Go) | 1K-10K req/sec | Add more instances behind LB |
| PostgreSQL (simple reads) | 10K queries/sec | Add read replicas or cache |
| PostgreSQL (writes) | 1K-5K writes/sec | Shard or switch to write-optimized DB |
| Redis | 100K ops/sec | Cluster mode (partition across nodes) |
| Kafka (per partition) | 10K-100K msgs/sec | Add partitions |
| Elasticsearch | 1K-10K queries/sec | Add shards |
| Object storage | Provider- and workload-specific request limits | Check current documentation, partitioning guidance, and benchmark results |
Use the table as a decision aid: when estimated traffic exceeds a measured or explicitly labeled working capacity, evaluate the next scaling technique. Do not treat a row as a universal limit.
Storage and size constants
| Data | Size | Notes |
|---|---|---|
| UUID | 16 bytes | 36 chars as string |
| Timestamp | 8 bytes | Unix epoch |
| Average tweet/post text | ~300 bytes | After encoding |
| Photo (compressed) | 200 KB - 2 MB | JPEG varies by resolution |
| Video (1 min, compressed) | 10-50 MB | Depends on codec/quality |
| 1 million integers | ~4 MB | 4 bytes each |
| 1 billion rows × 1 KB | ~1 TB | Common DB sizing |
Useful conversion factors
| Conversion | Value | Shortcut |
|---|---|---|
| Seconds in a day | 86,400 | Use ~100K (10^5) |
| Seconds in a month | ~2.5M | Use ~2.5 × 10^6 |
| Seconds in a year | ~31.5M | Use ~3 × 10^7 |
| 1 MB/sec sustained | ~2.5 TB/month | Useful for bandwidth costs |
| 2^10 | 1,024 | ~1 thousand (K) |
| 2^20 | ~1M | ~1 million (M) |
| 2^30 | ~1B | ~1 billion (G/Giga) |
| 2^40 | ~1T | ~1 trillion (T) |
The 3-step estimation formula
Every back-of-envelope calculation follows the same structure. Once you internalize this, you can estimate any system in 3 minutes.
Step 1: Traffic (Users → Requests/second)
Start from your Daily Active Users (DAU), which you locked down in Phase 2 (Non-Functional Requirements).
Reads per second = (DAU × reads_per_user_per_day) / 100,000
Writes per second = (DAU × writes_per_user_per_day) / 100,000
(Use 100K instead of 86,400 as a deliberate mental-math approximation. The resulting error is small enough for many order-of-magnitude decisions, but use the exact denominator when the boundary is close or the number affects cost or capacity materially.)
Example: Instagram-like photo sharing
- DAU: 10M
- Each user views feed 5 times/day (10 photos each = 50 reads)
- Each user uploads 0.1 photos/day (1 in 10 users posts daily)
Reads/sec = (10M × 50) / 100K = 5,000 reads/sec
Writes/sec = (10M × 0.1) / 100K = 10 writes/sec
Read:Write ratio = 500:1
That 500:1 ratio immediately tells you: this is a read-heavy system. Your primary scaling concern is reads, not writes. A cache layer will have massive impact.
Step 2: Storage (Data per object × Volume × Time horizon)
Daily storage = writes_per_day × size_per_object
Storage at Year 5 = daily_storage × 365 × 5
Example continued:
- 10M × 0.1 = 1M photos/day
- Average photo: 500 KB compressed
- Daily: 1M × 500 KB = 500 GB/day
- 5-year total: 500 GB × 365 × 5 = ~900 TB ≈ 1 PB
At 1 PB, photos belong in object storage rather than a relational database. The estimate drives a design decision: media goes in object storage, while metadata and references go in a database chosen for the access pattern.
Step 3: Bandwidth (Data transfer per second)
Read bandwidth = reads_per_sec × response_size
Write bandwidth = writes_per_sec × request_size
Example continued:
- 5,000 reads/sec × 500 KB photo = 2.5 GB/sec outbound, or about 20 Gbps
- That's significant. It justifies evaluating a CDN: serving 2.5 GB/sec from origin servers may be expensive or slow for global users. If an illustrative 90% hit rate holds, the CDN removes most of that origin traffic; validate the result.
Putting it together
| Metric | Value | Design decision |
|---|---|---|
| Read traffic | 5K reads/sec | Cache layer (Redis) absorbs most |
| Write traffic | 10 writes/sec | Single DB primary, no sharding needed |
| Read:Write ratio | 500:1 | Read-optimized architecture |
| Storage (5yr) | ~1 PB | Object storage for photos |
| Bandwidth | 2.5 GB/sec | CDN required |
Five lines of math that justify five architectural decisions. That's the power of estimation.
Interview tip: connect every number to a decision
Never compute a number without immediately stating what it means for the design. "5,000 reads/sec" by itself is trivia. "5,000 reads/sec, which means a single PostgreSQL instance can handle it but we'd want a cache for sub-ms latency" is engineering.
Worked patterns for common systems
You do not need to redo every conversion from scratch, but these are only starting patterns. Replace the ratios, volumes, and payloads with the prompt's assumptions.
Social media
Illustrative read:write starting range: 100:1 to 1000:1
Illustrative DAU range: 10M-500M
Key insight: feed generation is the scaling bottleneck, not storage
Design implication: aggressive caching + fanout strategy decision
Messaging
Illustrative read:write starting point: 1:1 (each message is written once and read by recipients)
Illustrative messages/day: DAU × 40-100 messages per user
Key insight: connection management (WebSockets) is the bottleneck
Design implication: state management for millions of persistent connections
E-commerce
Illustrative read:write starting point: 100:1 (browsing vs buying)
Illustrative order conversion: 2-5% of sessions
Key insight: cart and checkout are write-heavy but low-volume; catalog is read-heavy high-volume
Design implication: separate scaling strategies for catalog (cache) vs orders (ACID DB)
Video streaming
Illustrative storage: 10M videos × 500MB average = 5PB
Illustrative bandwidth: 1M concurrent streams × 5 Mbps = 5Tbps
Key insight: bandwidth costs dominate. Storage is cheap but delivery is expensive
Design implication: CDN with adaptive bitrate streaming
Common estimation mistakes
| Mistake | Why it's wrong | What to do instead |
|---|---|---|
| Spending 10+ minutes on math | Wastes design time | Cap estimation at 5 minutes. Round aggressively. |
| Computing storage without a time horizon | "500 GB" means nothing without timeline | Always state: "X per day, Y over 5 years" |
| Ignoring read:write ratio | Treating all traffic as equal | Split reads and writes first. The ratio drives your architecture. |
| Using peak traffic for everything | Over-provisions the entire system | Estimate average, then state an explicit peak multiplier from the workload. Design for peak and choose a scaling policy that balances cost and recovery time. |
| Estimating bandwidth but not acting on it | Computing numbers without connecting to decisions | Compare origin, network, egress, and latency requirements; evaluate a CDN or other delivery strategy when the workload justifies it. |
| Forgetting metadata overhead | Photo is 500KB but you still need DB rows | Estimate data store and metadata store separately |
Trade-offs, limitations, and failure modes
Estimation trades speed and simplicity against precision. Rounding makes the reasoning fast but can hide a boundary when the result is close to a capacity or cost limit. Average traffic is useful for baseline sizing but can hide bursts; peak traffic is safer for resilience but may over-provision a system with elastic capacity. Storage and bandwidth also have overhead, retention, replication, cache-miss, retry, and egress effects that the first multiplication does not capture.
An estimate can also be directionally correct and still fail operationally. A cache outage can amplify database reads, a queue can accumulate work faster than consumers drain it, and a replica or origin can become the bottleneck even when the application tier has headroom. State these failure paths and the protection—backpressure, bounded retries, rate limits, stale data, or a recovery plan—before treating the estimate as a capacity decision.
Interview application
When to estimate
Estimation is a tool, not a standalone phase. Pull it into requirements to set scale targets and into architecture or deep dives to justify component choices. The numbers should inform the decisions that matter, not every possible resource.
30-second answer
"I estimate only what can change the design. I start from users and actions, convert them into average and peak reads or writes, then calculate storage and bandwidth over a stated horizon. I round deliberately, label the assumptions, compare the result with a measured or illustrative capacity, and state the component choice and failure path it implies."
5-minute explanation
"First I clarify the workload: DAU or other traffic source, actions per user, read-to-write ratio, payload size, retention, peak multiplier, latency, consistency, and availability. Then I calculate traffic, storage, and bandwidth with units shown. I use 100K seconds per day as a mental shortcut when it is safe, and I distinguish bytes from bits and decimal from binary units.
"Next I connect each number to a decision. High write volume may require batching, asynchronous work, partitioning, or a write-optimized store; hot reads may justify a cache, replica, or CDN; large media may belong in object storage. I include metadata and operational overhead, model cache misses and retries, state the trade-off, and finish with the benchmark or measurement that would validate the boundary."
The signals interviewers look for
| Signal | What it looks like |
|---|---|
| Good: estimates drive decisions | "At an illustrative 50K reads/sec, we need a cache or another read strategy because the measured database capacity is lower." |
| Good: rounds to simplify math | "86,400 seconds, call it 100K. Close enough, makes the math instant." |
| Good: splits reads and writes | "Our read:write ratio is 100:1, so this is a read-heavy system." |
| Bad: estimates are decorative | Computes numbers, then designs without referencing them |
| Bad: false precision | "We need 4.217 TB of storage." Nobody needs 3 decimal places. |
| Bad: estimates everything | Computes storage for logs, metrics, backups. Only estimate what matters. |
Common interviewer follow-ups
| Interviewer asks | Strong answer |
|---|---|
| "How did you get that number?" | Show the chain: DAU → actions → requests/sec. Clear, reproducible. |
| "What if traffic is 10x higher?" | "At 10x, our illustrative 5K reads/sec becomes 50K. With a 95% hit-rate assumption, the database sees about 2.5K reads/sec; with a 99% hit-rate assumption, it sees about 500. I would recalculate bandwidth and validate the cache and database boundaries." |
| "Is that storage estimate realistic?" | "It's order-of-magnitude correct for the stated assumptions. In production I'd add measured overhead for indexes, replicas, backups, and tombstones. If the added overhead does not change the architecture, I would keep the estimate rounded." |
Interview tip: say your rounding out loud
When you round 86,400 to 100,000 or 2.6M to 3M, say it: "I'm rounding up to keep the math simple. The approximation is sufficient for this decision; I would use exact values if the boundary were close." This makes the precision trade-off explicit.
Test Your Understanding
Use the following prompts to practice estimating one dominant quantity and connecting it to a decision.
Recap
- Every estimation follows three steps: traffic (users to req/sec), storage (size × volume × time), bandwidth (req/sec × payload size).
- Use PostgreSQL, Redis, and app-server numbers as illustrative capacity assumptions only; workload-specific benchmarks define the decision boundary.
- Always split read and write traffic. The ratio drives your entire architecture.
- Round deliberately (86,400 → 100K) and say it out loud. Precision is useful only when it can change the decision.
- Connect every number to a design decision. An estimate without a consequence is decoration.
- Peak traffic is workload-specific; state the multiplier and design for the failure and recovery behavior it creates.
- For video and media platforms, bandwidth may dominate; for text platforms, storage and compute may dominate. Estimate rather than assume.
Related Concepts
- Approach & Structure - The 6-phase framework that estimation plugs into. Use estimation inside Phase 2 (NFRs) and Phase 5 (Architecture) to justify decisions with numbers.
- Capacity Planning - Takes your estimates and translates them into infrastructure decisions: server counts, shard counts, replica counts.
- Scalability - The concept your estimates are sizing for. Understanding vertical vs. horizontal scaling determines which ceiling matters.
- Caching - The first component justified by estimation. When reads exceed DB capacity, caching is the answer.
- Databases - Understanding database throughput ceilings is half of the estimation skill.
Related Articles
A 6-phase framework for any system design interview: requirements, NFRs, APIs, flows, architecture, and deep dives, with time splits for each.
Translate estimates into infrastructure decisions: when to add a cache, when to shard, when to go multi-region, and how to present it in an interview.
A practical guide to common system design interview mistakes, organized by category, with concrete examples and fixes.