Capacity planning in system design
Translate estimates into infrastructure decisions: when to add a cache, when to shard, when to go multi-region, and how to present it in an interview.
TL;DR
- Capacity planning is the bridge between estimation and architecture. You've computed the numbers, now you use them to pick components and decide scaling strategies.
- Systems encounter scaling inflection points: workload thresholds where the current approach stops meeting its target and another technique becomes worthwhile. Knowing the likely thresholds supports proactive design and avoids reactive firefighting.
- A useful scaling ladder is: single server → separate DB → caching → horizontal app scaling → sharding → multi-region. Use it as a sequence of questions, not as a mandatory five-rung jump.
- For your interview: state the current traffic, name the bottleneck, pick the solution, and explain what traffic level would force the next step. That loop is the entire capacity planning skill.
- Over-provisioning is as much a failure as under-provisioning. The goal isn't maximum scale. It's the right scale for the right cost.
Why this framework matters
You've done the estimation. You know you'll have 50K reads/sec and 500 writes/sec. Your storage grows at 2TB per year. Great.
Now what?
This is a common point of confusion. The numbers are on the whiteboard, but they have not yet been connected to infrastructure choices. "We'd need to scale the database" is incomplete: scale how—more memory, read replicas, sharding, or a different data store?
Capacity planning is the discipline of translating estimates into decisions. It answers: given these traffic and storage numbers, what components do I need, how many instances of each, and what breaks first as we grow?
An estimate is useful only when it changes a design decision. Capacity planning is the step that makes that connection explicit: it identifies the first constrained resource, chooses a proportional response, and shows how the design should evolve as the workload changes.
For your interview: every number you write on the board should have an arrow pointing to a design decision. If an estimate doesn't change your architecture, delete it and spend that time elsewhere.
The 'just add more servers' fallacy
"We'll horizontally scale" is not a capacity plan. Which tier scales? At what threshold? What's the bottleneck that prevents linear scaling? If your database is the bottleneck, adding 100 app servers gives you 100 app servers queuing on one database. Capacity planning is about identifying which component hits its ceiling first and solving that specific bottleneck.
When to use this framework
Use capacity planning after you have a scoped workload and rough estimates for traffic, storage, bandwidth, latency, and availability. Revisit it whenever an access pattern, retention period, traffic peak, or failure requirement changes. It is useful in interviews and in design reviews where the question is not only “can this work?” but also “what becomes constrained first, and what is the next reversible investment?”
The ladder below is a reasoning aid, not a universal migration sequence. A system may need a read replica before a cache, an object store before a database split, or regional isolation before any of these steps. Let the measured or explicitly stated bottleneck determine the move.
Illustrative planning inputs
Throughput, latency, storage, node-count, and cost figures in this article are illustrative assumptions for interview math, not universal limits or provider guarantees. Actual capacity depends on the workload, schema, hardware, configuration, replication, traffic shape, and failure budget; benchmark the critical path before committing to a production size.
Step-by-step method: scale the bottleneck
Use this loop for each major component:
- Establish the workload. Separate average and peak reads, writes, storage growth, bandwidth, and the latency or availability target.
- Find the first constraint. Compare each resource with an explicitly stated capacity assumption or benchmark. Include dependencies such as connections, disk, queue depth, and replication bandwidth.
- Choose the smallest effective change. Prefer query or schema improvements, vertical scaling, caching, replicas, or asynchronous work before adding distributed coordination.
- Recalculate after the change. Account for cache misses, replicas, fan-out, headroom, and failure traffic rather than assuming the component scales in isolation.
- State the next boundary and failure mode. Explain what traffic level or failure condition requires the next step and how the system behaves while that step is unavailable.
Reference model: the scaling ladder
Many systems can be reasoned about with a progression like this as they grow. Each rung addresses a different bottleneck and introduces new operating costs.
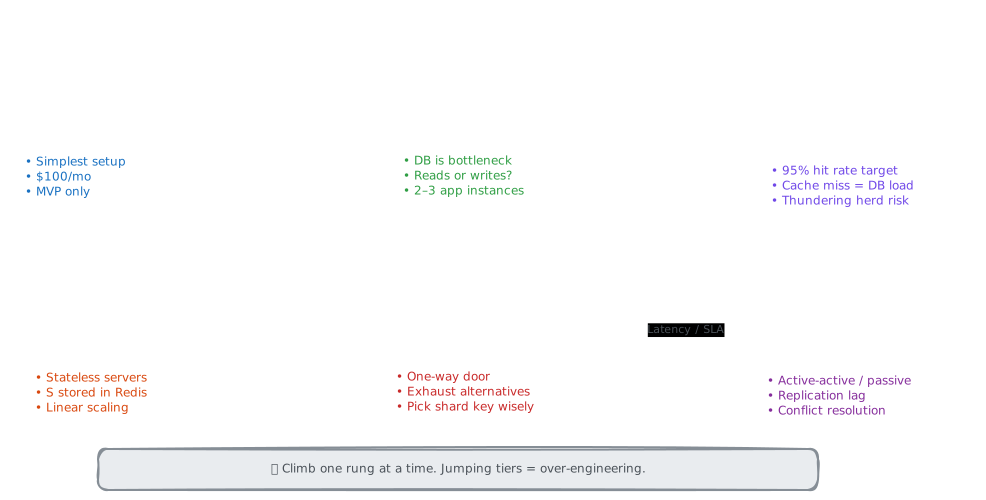
Tier 1: Single server (illustrative small workload)
Setup: One machine running everything: web server, application, database.
Bottleneck: CPU and memory are shared between all processes. Database I/O competes with application processing.
When to move on: Sustained CPU around 70-80% under normal load can be a useful trigger, but the actual signal may be latency, memory, disk, connection pressure, or a no-downtime deployment requirement.
What is easy to miss: this tier may be appropriate for an early-stage product with modest traffic. A single modest server can be a reasonable starting point when availability, deployment, and workload requirements allow it. Opening with a load balancer, cache cluster, and event platform for an MVP adds failure modes before a requirement justifies them.
Tier 2: Separate database (illustrative moderate load)
Setup: Application server and database on separate machines. Possibly a load balancer in front of 2-3 app server instances.
Bottleneck: Database becomes the constraint. All reads and writes hit one instance.
Key decision: Is the bottleneck reads or writes?
- Read-heavy (most systems): Add a cache (Tier 3) or read replicas
- Write-heavy: Optimize your schema, add indexes, or start planning for sharding (Tier 5)
Illustrative capacity assumption: For simple, well-indexed queries, use a rough working range of ~10K reads/sec and ~1-5K writes/sec for a single PostgreSQL instance. Treat this as a placeholder for a benchmark, not a product limit. If the workload is comfortably below the measured capacity, additional database distribution may not be necessary.
Tier 3: Add caching (illustrative read-heavy load)
Setup: Redis or Memcached sits between the app tier and the database. Most reads are served from cache.
Bottleneck: Cache miss rate determines database load. At 95% hit rate, only 5% of reads reach the database. But if the cache fails, 100% of reads hit the DB (thundering herd).
Key decisions:
- What to cache (hot data, session data, computation results)
- TTL strategy (staleness tolerance drives TTL length)
- Invalidation approach (TTL-based, event-driven, or both)
Illustrative capacity assumption: Use ~100K operations/sec as a working single-instance ceiling in this example. At a 95% hit rate with 100K reads/sec total, Redis handles 95K and the DB handles 5K; validate both numbers against the chosen workload and configuration.
When this tier isn't enough: When write traffic exceeds single-DB capacity, or when you need geographic distribution. Caching helps reads, not writes.
Tier 4: Horizontal app scaling (illustrative higher load)
Setup: Multiple stateless app servers behind a load balancer. Sessions stored externally (Redis). Shared-nothing architecture.
Bottleneck: The app tier may scale near-linearly while each instance remains stateless, but the database, cache, network, and connection pools become the likely limits.
Key decisions:
- Load balancing algorithm (round-robin is fine for stateless)
- Health checking (remove unhealthy instances quickly)
- Deployment strategy (rolling updates, blue-green, canary)
Illustrative capacity math: If each app server handles 2K req/sec for this request profile and you need 100K req/sec, you need 50 app-server instances. Adding 20% headroom for failures and spikes gives 60 instances; benchmark the per-instance capacity and choose headroom from the failure budget.
This tier is the easiest to scale because app servers are stateless. If you need 2x capacity tomorrow, you double the instances. The hard part is everything stateful: databases, caches, queues.
Tier 5: Database sharding (when measured writes exceed single-DB capacity)
Setup: Data is partitioned across multiple database instances by a shard key (usually user_id, tenant_id, or geographic region).
Bottleneck: Cross-shard queries, shard imbalance (hot shards), and operational complexity (schema migrations across shards).
Key decisions:
- Shard key selection (determines data distribution and query patterns)
- Number of shards (start with the minimum needed, typically 4-16)
- Rebalancing strategy (consistent hashing makes adding shards less painful)
When to shard: When your single-primary write throughput exceeds capacity and you've already optimized queries, added proper indexes, and considered vertical scaling (bigger machine). Sharding is a last resort, not a first choice, for relational databases.
Tier 6: Multi-region (global users or regional-failure requirement)
Setup: Full application stack deployed in 2-3+ regions. Data replicated across regions with eventual or causal consistency.
Bottleneck: Cross-region replication lag, data consistency, and conflict resolution.
Key decisions:
- Active-active vs. active-passive
- Which data gets replicated where
- Conflict resolution strategy (last-write-wins, CRDTs, manual resolution)
Common reasons to go multi-region include:
- Latency: users are distributed geographically and the target cannot tolerate the round trip to one region.
- Availability or residency: the requirements include surviving a regional outage or keeping data in specified jurisdictions.
If neither requirement applies, a single region is often simpler. Multi-region adds complexity to data consistency, deployment, observability, and incident response, so the target and failure scenario should justify it.
Check each component
For every component in your design, run through this checklist:
| Question | How to answer | Design decision |
|---|---|---|
| What's the read throughput? | From estimation: reads/sec | Need cache? Need read replicas? |
| What's the write throughput? | From estimation: writes/sec | Single primary enough? Need sharding? |
| What's the storage at Year 1? Year 5? | From estimation: size × volume × time | Fits in one DB? Need object storage? |
| What's the availability requirement? | From requirements: SLA % | Need replicas? Multi-region? |
| What's the latency requirement? | From requirements: p99 target | Need cache? Need CDN? Need local region? |
| What happens at 10x traffic? | Scale your estimates by 10 | Which tier ceiling do you hit first? |
The "10x" question is a useful growth exercise. When someone asks "how would you handle 10x growth?", walk up the scaling ladder and explain which assumption or bottleneck changes first.
Interview tip: the 'what breaks first' technique
When presenting your design, proactively say: "At our current estimates, the system handles the load with this architecture. At 10x, the first bottleneck would be [X], and I'd solve it by [Y]. At 100x, the next bottleneck is [Z]." This demonstrates that you think about systems dynamically, not as a fixed point-in-time snapshot.
Worked example: e-commerce product catalog
The following is an illustrative capacity planning exercise for an e-commerce product catalog. Replace the assumptions with values from the prompt or with production measurements.
Requirements (from Phase 1):
- 5M DAU, 50M MAU
- Users browse ~20 products per session, 2 sessions per day
- 10K new products added per day by merchants
- Product pages must load in under 200ms (p99)
Estimates (from Phase 2):
- Reads: 5M × 20 × 2 / 100K = 2,000 reads/sec
- Writes: 10K / 100K = 0.1 writes/sec (negligible)
- Read:Write ratio: 20,000:1 (extremely read-heavy)
- Storage: 10K products/day × 5KB per product × 365 × 5 = ~90 GB over 5 years
- Product images: 10K × 3 images × 200KB = 6 GB/day → ~11 TB over 5 years
Capacity decisions:
| Component | Decision | Reasoning |
|---|---|---|
| Database | Single PostgreSQL, no sharding | 2K reads/sec and 0.1 writes/sec are below the illustrative single-instance assumption. Validate with the actual query mix and headroom target. |
| Cache | Redis with product data | The 200ms p99 target and read-heavy access pattern justify evaluating a cache. Measure the database and cache path rather than assuming a fixed latency. |
| Product images | Object storage + CDN | ~11 TB over 5 years belongs outside the relational database. A CDN can reduce origin traffic and distance for cacheable content; coverage and latency depend on placement and hit rate. |
| App servers | 2-3 instances | Assuming 1K req/sec per instance for this request profile, 2K req/sec needs two instances; an additional instance provides failure and deployment headroom. Benchmark the request profile. |
| Search | Search index | Product search queries cannot be served by primary-key lookups alone. Full-text search needs a separately operated index with its own capacity plan. |
At 10x growth (50M DAU, keeping the other ratios constant):
- Reads jump to 20K/sec. Under the illustrative Redis assumption, the cache remains below its working ceiling.
- DB sees ~1K reads/sec on cache misses with a 95% hit-rate assumption. That remains below the illustrative single-instance capacity assumption.
- Image ingestion grows from 6 GB/day to 60 GB/day. Delivery bandwidth needs a separate assumption for product views and payload size.
- A likely next bottleneck is the search index if search queries grow proportionally, but that must be confirmed from its query and indexing workload.
At 100x growth (500M DAU, keeping the other ratios constant):
- Reads: 200K/sec. This exceeds the illustrative single-instance Redis ceiling, so evaluate clustering or another partitioned cache.
- DB: 10K reads/sec on cache misses. This reaches the illustrative single-instance boundary, so evaluate read replicas or another read strategy.
- Now consider sharding PostgreSQL, but only if the product catalog exceeds memory (unlikely at 90GB).
For an interview, the value of this progression is the reasoning: show which assumptions scale, identify the first measured constraint, and sequence the next investments. Do not present the multiples as product facts unless the prompt supplies them.
Trade-offs, limitations, and failure modes
Capacity planning balances cost, headroom, latency, availability, and operational complexity. More replicas or pre-warmed instances reduce some failure and scaling risks but increase cost. A cache reduces database reads but introduces staleness, invalidation work, and a failure-amplification path. Sharding can increase write capacity but makes queries, migrations, rebalancing, and incident response harder.
The estimates are also sensitive to workload shape. Average traffic can hide bursts, follower-count skew, cache misses, retries, connection pools, disk growth, and replication lag. Treat every threshold as an assumption until a representative benchmark or production measurement supports it. When a component fails, protect its dependency with bounded retries, backpressure, rate limits, stale or degraded responses where acceptable, and an explicit recovery plan.
Capacity is not a guarantee
A node count derived from average throughput does not prove that the system will survive a peak or a failure. Recalculate for peak load, one or more unavailable instances, cache misses, queue replay, and recovery work before calling the design ready.
Interview application
Four-step presentation loop
Here's the exact flow that works:
Step 1: State the bottleneck
"Based on our illustrative estimates of 50K reads/sec and 500 writes/sec, the read traffic is the primary scaling concern. Under the working assumption that a single database handles about 10K simple reads/sec, we need either caching or read replicas; I would validate the choice with the actual query mix."
Step 2: Pick the solution and justify it
"I'll add a Redis cache with an illustrative 90-95% hit-rate assumption. At 95% hit rate, the database sees 2.5K reads/sec (5% of 50K). That is below the working single-instance capacity assumption, subject to a benchmark. Redis handles 100K operations/sec in this example, so 47.5K cached reads leaves headroom under that assumption."
Step 3: State the next inflection point
"Under these illustrative assumptions, this architecture has a practical boundary below 200K reads/sec because the cache and database are the limiting components. Beyond the measured cache capacity, I'd move to a partitioned or replicated cache. For writes, 500/sec is below the working single-primary assumption; I wouldn't consider sharding until measured write capacity and simpler mitigations were exhausted."
Step 4: Address failure scenarios
"If Redis goes down, 50K reads/sec could hit the DB directly, which exceeds the illustrative single-instance capacity assumption. I'd mitigate with: (1) a local in-process cache as L1 with a bounded TTL, (2) a circuit breaker that serves stale data during cache recovery, and (3) read capacity that can be added or activated when cache health degrades."
This four-step pattern (bottleneck → solution → next inflection → failure mode) works for any component at any scale. Practice it until it's automatic.
When to use capacity planning in an interview
Use it during architecture and deep dives as each major component is added. Every time you draw a new box, briefly state why it is needed and what load it handles. Estimation can be pulled in whenever a decision needs a number; it does not need to be a separate timed section.
30-second answer
"Capacity planning turns workload estimates into component decisions. I separate average and peak load, identify the first constrained resource, choose the smallest mitigation, and recalculate the remaining load. I also state the next scaling boundary and the failure behavior, so the design explains both normal operation and how it evolves."
5-minute explanation
"First I write down reads, writes, storage growth, bandwidth, latency, availability, and the assumptions behind each number. Then I compare those values with measured or explicitly illustrative component capacities and include dependencies such as cache misses, connection pools, disk, queues, and replication. I add only the component that addresses the first bottleneck: perhaps a cache or read replica for reads, batching or asynchronous work for writes, or sharding only after simpler database options are exhausted.
"Next I recalculate the load after the change and walk through a 10x scenario. Finally, I describe the most likely and most damaging failure modes—for example, protecting the database from a cache outage—and say what traffic or reliability requirement would force the next architectural step. This keeps the design proportional to the workload and makes each investment defensible."
Common interviewer follow-ups
| Interviewer asks | Strong answer |
|---|---|
| "How many servers do you need?" | "Assuming each server handles 2K req/sec for this workload, 50K req/sec needs 25 instances. I would add explicit headroom for failures and deployments, then validate the count with load testing." |
| "When would you shard?" | "When measured writes exceed the capacity of a single primary and vertical scaling, query optimization, batching, partitioning, and CQRS are no longer sufficient. The traffic multiple depends on the workload." |
| "How would you handle a viral event?" | "The stateless app tier can scale out. The CDN can absorb read amplification. The risk is the cache: if one viral item expires and all users request it simultaneously, we get a thundering herd on the DB. I'd use a mutex or single-flight pattern so only one request populates the cache while others wait or serve a bounded fallback." |
| "What's your infrastructure cost?" | "I would give a clearly labeled order-of-magnitude estimate only after stating region, traffic, storage, retention, and egress assumptions. Provider pricing and measured utilization determine the real number; I would compare the simple and distributed designs on that basis." |
Interview tip: the cost estimate
A rough cost estimate can be useful when the prompt includes a cost constraint. State the assumptions, use current provider pricing if this were a real design, and keep the result as an order-of-magnitude comparison rather than a quote.
Test Your Understanding
Use one or two of the following prompts to rehearse the bottleneck → decision → next boundary → failure-mode loop.
Recap
- Capacity planning translates estimates into infrastructure decisions. Every number from estimation should have an arrow pointing to a component choice.
- The scaling ladder has six tiers: single server → separate DB → caching → horizontal app → sharding → multi-region. Climb one rung at a time.
- Always identify the bottleneck first. Is it reads, writes, storage, latency, or availability? The bottleneck determines the next scaling technique.
- State inflection points explicitly: "This architecture handles up to X under these assumptions. Beyond that, we need Y."
- Sharding is a last resort for relational databases. Exhaust vertical scaling, query optimization, and CQRS first.
- Multi-region adds value when latency, availability, or data-residency requirements justify its consistency and operating cost.
- Cost estimates are useful when their assumptions are visible; provider prices and measured utilization determine the real number.
Related Concepts
- Estimation - The numbers that feed into capacity planning. You can't plan capacity without first estimating traffic, storage, and bandwidth.
- Scalability - The underlying concept behind the scaling ladder. Vertical vs. horizontal scaling, stateless vs. stateful tiers.
- Data partitioning - A deeper look at Tier 5 of the scaling ladder: shard-key selection, rebalancing, and the operational cost of distributed data.
- Caching - Tier 3's primary tool. Cache-aside, write-through, and the thundering herd problem that makes cache failure a capacity planning concern.
- Replication - The mechanism behind read replicas and multi-region data distribution. Understanding replication lag is essential for capacity planning.
Related Articles
The 3-step estimation formula for system design interviews: practical reference values, decision-driving math, and shortcuts that save time.
A 6-phase framework for any system design interview: requirements, NFRs, APIs, flows, architecture, and deep dives, with time splits for each.